Denver Preschool Program
Child Outcome Evaluation 2014 – 2015
Part A
Preschool Progress and School Readiness
Evaluation Cohort 7 Preschool Report
Document Summary
The Part A report focuses on the developmental outcomes of Denver Preschool Evaluation Cohort 7 comprised of a randomly selected, stratified sample of children who participated in DPP during the 2014-2015 school year. The outcomes focus on children’s progress during the preschool year on literacy, math, vocabulary, executive function, and social emotional development. School readiness indicators are examined, in addition to subgroup comparisons based on income and primary language of the child.
 Clayton Early Learning Research and Evaluation Department
 Clayton Early Learning Research and Evaluation Department
 Research Contacts:
Sheridan Green, Ph.D., Vice President, Research and Evaluation, sgreen@claytonearlylearning.org
Diana Mangels, M.A., Director, Research and Evaluation, dmangels@claytonearlylearning.org
Recommended Citation:
Green, S., Ponce, C., Mangels, D, & Landgraff, C. (2015). Denver Preschool Program Child Outcome Evaluation 2014-2015: Part A: Preschool Progress and School Readiness, Evaluation Cohort 7 Preschool Report. Unpublished Report, Denver, CO.
Acknowledgements:
The current work is informed by strong partnerships with APA Consulting (Dr. Bob Palaich, Kathryn Rooney and Team), the DPP Evaluation Committee, and the DPP staff. The ongoing design and analytic plan for this evaluation were originally developed and conducted by Dr. Mary Klute, the former Senior Director of Research and Evaluation at Clayton.
Introduction
The Denver Preschool Program (DPP) is a taxpayer-funded initiative, reauthorized by voters in 2014, that increases access to high-quality preschool for Denver’s four-year old children. DPP operates on the premise that preschool plays an important role in the academic and social-emotional development of children and that participating in a high-quality preschool experience, even for only one year, can have a positive impact on a child.
The program encourages families to enroll their children in preschool by providing tuition credits to parents to offset the cost of preschool. The size of the tuition credit each family receives is determined by the family’s income, the size of the family, and the quality rating of the preschool the child attends. DPP provides funding for preschools serving children who live in Denver to obtain a DPP quality rating. Participating programs also receive access to professional development (e.g., training and coaching) and quality improvement grants to assist them in their efforts to improve their quality.
Clayton Early Learning’s Research and Evaluation Department collaborates with Augenblick, Palaich and Associates to complete an annual child outcomes evaluation of DPP. The work is focused on questions related to the development of children enrolled in DPP both during their preschool year and beyond. This report focuses on the developmental outcomes (questions bolded below) of Cohort 7 comprised of a randomized, stratified sample of children who participated in DPP during the 2014-2015 school year addressing questions 1 through 3 below. The companion report for this work describes longitudinal outcomes (see Denver Preschool Program Child Outcome Evaluation 2014-2015: Part B: Longitudinal Follow-up, Evaluation Cohorts 1-6 Elementary Report), addressing questions 4 and 5.
Evaluation Questions
- Do children make progress in their development while in DPP early childhood environments (i.e., language, literacy, mathematics, and social-emotional development)?
- To what extent and in what areas are children enrolled in DPP ready for kindergarten?
- Do children from different income levels and with different primary languages make similar progress in their development while in DPP early childhood environments?
- Do children who received DPP tuition credits compare favorably with the district as a whole on assessments administered by Denver Public Schools (DPS) in kindergarten and beyond?
- Is attendance at higher-rated preschool programs associated with greater kindergarten readiness and long-term academic success (as measured by TCAP)?
Method and Procedures
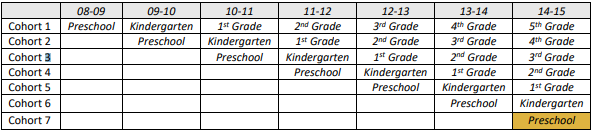
The 2014-2015 school year marked the eighth year of the DPP program. The cohort from the second year of DPP’s operation was the first group of children for whom the program’s evaluation design was implemented. Children in Evaluation Cohort 1 were expected to be enrolled in fifth grade during the 2014-2015 school year, while Cohort 7 was enrolled in their preschool year preceding fall eligibility for kindergarten.
Table 1. DPP Evaluation Cohorts and Expected Grade Levels by School Year
Each year, a representative sample of 200 DPP children are selected to take part in the child outcome study that examines progress made over the preschool year, spring school readiness and longitudinal outcomes. Families, teachers and children are invited via a variety of methods to participate in the study. They receive gift card incentives and the results of the child assessments that are conducted throughout the year.
Children take part in direct child assessments once in the fall and once in the spring in English. Dual language learners are additionally assessed in Spanish. A more in-depth explanation of the sampling, stratification, recruitment and assessment procedures are provided in the 2014-2015 Technical Appendix.
Preschool Measures
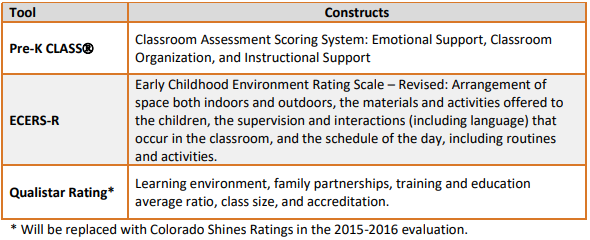
Children’s progress and school readiness are informed by individual data collection of the child assessment measures shown in Table 2. Classroom quality is indicated in several ways using the measures and rating scales presented in Table 3.
Table 2. Child Development Domains Assessed
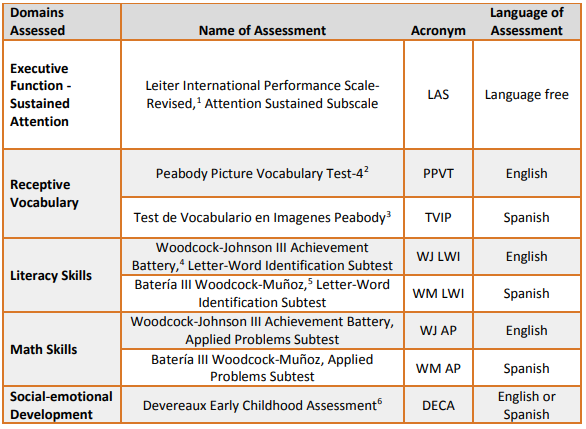
Table 3. Classroom Quality Measures
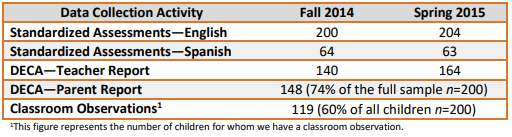
In 2014-2015, a total of 204 DPP students were enrolled in the study (community n=105, DPS n=99). These children attended DPP programming in 154 classrooms with 156 teachers across 107 program sites. Table 4 shows the sample sizes for each data element collected.
Table 4. Sample Sizes by Data Collection Type, Fall 2014 and Spring 2015
Cohort 7 Preschool Progress in 2015
Preliminary Analyses
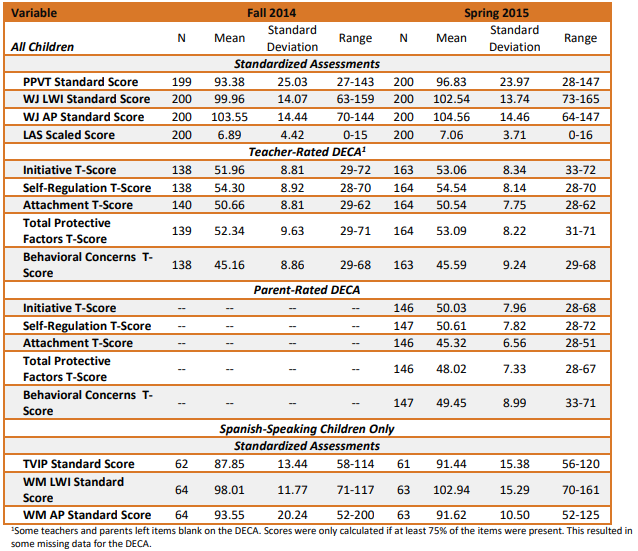
Table 5 presents descriptive statistics for fall and spring child outcome measures. The PPVT, TVIP, WJ and WM are all scaled such that 100 is an average score, with a standard deviation of 15. Scores within one standard deviation of the mean are considered in the average range (i.e., 85-115). All scores are adjusted for the child’s age at the time of assessment. As such, one would expect a child who is developing at an average rate to have the same approximate score over time. In both the fall and the spring, children, on average as a group, scored in the average range for all of the standardized assessments. On average, scores for the PPVT and TVIP (receptive vocabulary) tended to be lower than those for the WJ and WM (literacy and math). It is noteworthy that for all of these assessments, there is considerable variability in children’s scores, with some individual children scoring quite low and some scoring rather high.
The Leiter Sustained Attention subtest of executive function is a criterion-referenced assessment (unlike the norm-referenced measures described above) that derives a scaled score using the raw correct and incorrect responses. A score of 10 is the national average, with any scores lower than a 7 indicating there may be some underlying attentional difficulties.
The DECA is scaled using T-scores, which have a mean of 50 and a standard deviation of 10. In both the fall and spring, teachers rated children (as a group) fairly close to the national average of 50 on all of the subscales, with a slightly higher average score on self-regulation. Parent ratings of children were (as a group) close to the national average, with slightly lower scores on Attachment. Once again there was substantial variability in all of the scores (see ranges listed in the table).
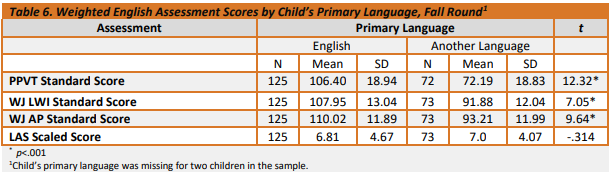
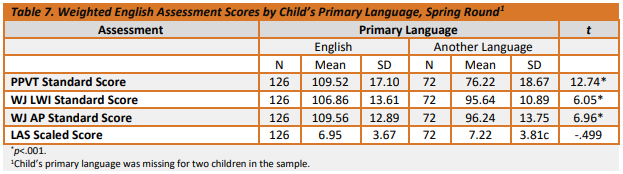
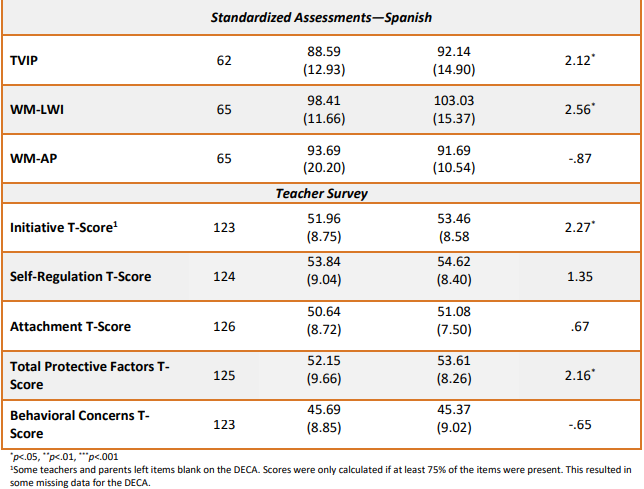
Since all children were assessed in English, regardless of their primary language, it is useful to consider whether children’s scores on the English assessments differed based on whether children spoke English as their primary language. We performed t-tests to examine whether there were differences in PPVT, LWI, AP, and LAS by primary language group (i.e., English vs. any other language). Results for the fall round are presented in Table 6. In the fall round, there was a large difference in the scores on the PPVT by primary language. Children whose primary language was English, scored over two standard deviations higher on the PPVT than their counterparts with another primary language. For AP, children whose primary language was English, scored close to one standard deviation higher on average than their counterparts with a different primary language. All differences were statistically significant. No differences by language were observed for LAS (executive function). A similar pattern of findings was observed in the spring round (Table 7). For this round, the differences were also statistically significant, including the group differences for LAS. Similar to the fall, the largest difference between the primary-language groups was observed for the PPVT, was over two standard deviations in magnitude. Differences between primary language groups for LWI and AP were similar to the fall, and still statistically significant. For LWI and AP, the difference between language groups was about one standard deviation in magnitude.
Table 5. Weighted Descriptive Statistics for Child Outcome Measures
Change in Assessment Scores over the Preschool Year
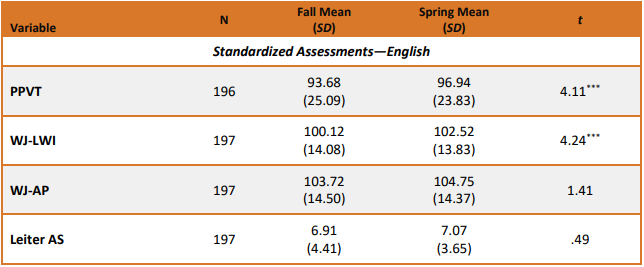
A series of paired t-tests was conducted to test for change over time in standardized assessments in English and Spanish as well as teacher-rated DECAs. Results are presented in Table 8. Significant increases were found for PPVT and in WJ LWI (small in magnitude, about a fifth of a standard deviation). For Applied Problems, there was no significant change. It is important to keep in mind that these scores are adjusted for age, so when increases are observed, they are above and beyond what one would expect due to typical maturation. The Leiter Attention Sustained scale is a criterion-referenced test (not adjusted for age), but rather uses a cutoff (criterion) for indicating adaptive levels of attention. A scaled score of seven or below may indicate attentional difficulties, and nationally, a scaled score of 10 is average. No significant increase was observed for executive function, however children’s results reflected the national average by spring. For assessments administered in Spanish, there was a moderate increase in TVIP and WM LWI scores over the course of the school year, about a quarter to a third of a standard deviation. No difference was observed for WM AP from fall to spring.
Significant improvements were also observed in two of the teachers’ ratings on the DECA over the course of the school year. Change over time was significant and positive for the protective factor Initiative, as well as for Total Protective Factors. No significant decreases in Behavioral Concerns over the course of the school year were reported.
Table 8. Change in Child Outcome Variables During the Preschool Year
Cohort 7 Subgroup Comparisons
Change over Time by Subgroup
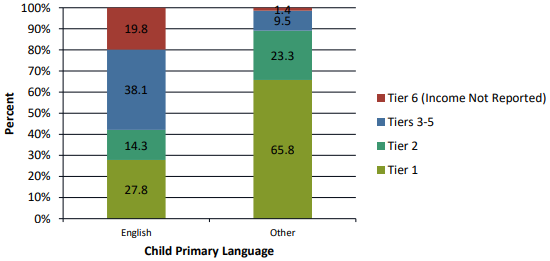
Further analyses were conducted to test whether the extent of the change over time varied by two background characteristics: income tier and children’s primary language. Prior to conducting analyses by income tier, some data reduction/combination was necessary since the number of participants from some of the income tiers was rather small. Income tier was collapsed into a new income tier group variable with 4 categories: Tier 1, Tier 2, Tiers 3-5 and Tier 6 (i.e., parents who opted out of the requirement to report income and instead elected to automatically be assigned to the lowest tuition credit level).7 It is important to note that these two background characteristics, income tier and child’s primary language, are strongly associated (see Chart 1).8 Nearly all children whose primary language is not English are from Tiers 1 or 2 whereas only about 42% of the children whose primary language is English are from these lowest two tiers. As a result, in this sample, it will be impossible to disentangle the effects of income and primary language and any effects observed are possibly the result of the co-occurrence of these two factors.
Chart 1. Income Tier Groups, by Child Primary Language
Income Tier
A series of Repeated Measures ANOVAs9 was conducted with income tier group predicting scores over time on assessments administered in English and Spanish as well as teacher-rated DECA. Like with last year’s findings, no significant interactions (i.e., tiers didn’t change at different rates on average) were found between income tier group and time for any of the scales (PPVT, WJ LWI, WJ Applied Problems, Leiter AS, WM LWI, WM Applied Problems, or TVIP), including the teacher-rated DECA subscales. In all cases, the income tier by time interaction was non-significant, indicating that children progressed similarly in these areas over the course of their preschool year, regardless of their income tier.
Children’s Primary Language
A series of Repeated Measures ANOVAs was conducted with primary language predicting scores over time on assessments administered in English and teacher-rated DECA.10 Only one significant interaction was found (between primary language group and time for the WJ AP) meaning that the rate of change for math differed by language (non-English speakers increased at a greater rate11).
Cohort 7 Kindergarten Readiness
Analyses were conducted to determine how ready for kindergarten DPP participants appeared to be at the end of their preschool year. Readiness was examined in several ways. First, we examined whether children scored in the average range as defined by the test publishers, namely a standard score of 85 or above. A score of 85 or above can be interpreted as not being in the risk range for the assessment. While not being at risk when entering kindergarten is important, it is also useful to examine whether children meet a higher standard, defined as scoring at or above 100, the population mean, on the assessments used in the study. Chart 2 presents the percentage of children scoring 85 or above and 100 or above on each of the assessments at the spring time point. In the general population, one would expect about 84% of children to score above 85 and 50% of children to score above 100. DPP and their evaluators are exploring new benchmarks and ways of displaying the data to accurately and realistically represent the concept of school readiness.
Not surprisingly, follow-up analyses revealed that the likelihood of scoring 85 or above on these assessments was strongly associated with children’s primary language (with similar findings for home language). Over 95% of children whose primary language was English scored 85 or above on the PPVT as compared with 36% of children whose primary language was not English.12 A different pattern was observed for WJ LWI and AP with more non-English speakers reaching scores above 85 than previous years. Nearly all children (97%) whose primary language was English scored 85 or above on WJ LWI as compared with 83% of children whose primary language was not English.13 Nearly all children whose primary language was English (98%) scored 85 or above on WJ AP compared with 80% of children with another primary language.14
A more pronounced pattern of differentiated results emerged when a score of 100 was used as the cutoff. For PPVT, for instance, three-quarters children whose primary language was English (73%) earned a score of 100 or greater as compared with just 9.5% of children with another primary language.15 For WJ LWI, 75% of children whose primary language was English scored 100 or greater as compared with 39% of children with another primary language.16 Finally, for WJ Applied Problems, 77% of children whose primary language was English earned scores of 100 or above compared with 45% of children whose primary language was something other than English.17
For assessments administered in Spanish, scores were stronger for LWI and Applied Problems than for vocabulary (TVIP), differing slightly from the pattern observed for the assessments in English. Almost 90% of children scored 85 or above on WM LWI and 91% of children scored 85 or above on Applied Problems. In contrast, just 65% of children scored 85 or above on the TVIP. About a third of children scored 100 or above on the TVIP, about 61% scored 100 or above on the WM LWI, and less than 20% of all children scored 100 or above on WM Applied Problems. It is important to keep in mind that all of these assessments were normed with children learning only one language. Language development for children learning two languages is expected to progress at a different pace than for children learning one language. One way to address this issue is to jointly look at bilingual children’s scores in both languages.
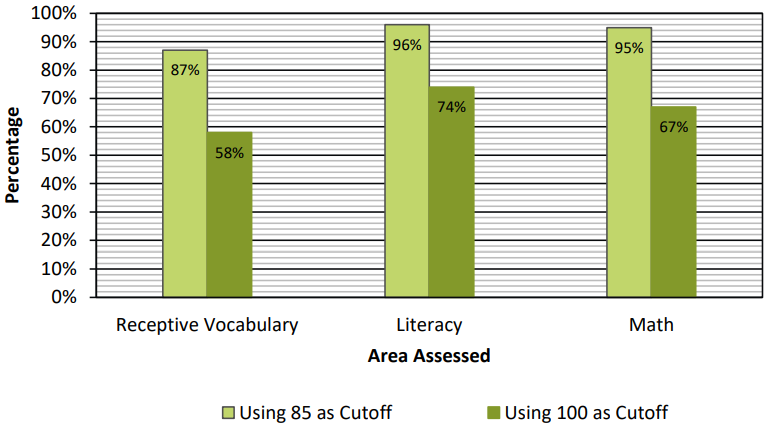
A variable was constructed to indicate whether children met or exceeded the two cutoff scores (85 and 100) in at least one language for each standardized test. Children who were bilingual could meet this criterion by meeting or exceeding the cutoff in either language. Children who were only assessed in English had only one opportunity to meet or exceed the cutoff. Results of this analysis are presented in Chart 2. More than 87% of children met or exceeded the cutoff of 85 in at least one language in the area of receptive vocabulary (i.e., PPVT or TVIP). Nearly all children met or exceeded the cutoff of 85 in at least one language on the literacy assessment (WJ-LWI or WMLWI) and the math assessment (WJ-AP or WM-AP). When a score of 100 was used as a cutoff, 58% of children met or exceeded this benchmark for vocabulary; approximately three-quarters met or exceeded this benchmark for literacy and 67% for math.
Chart 2. Weighted Percentage of Children Scoring in the Average Range or Above on Spring Standardized Assessments in Spanish or English
When considering the analyses reported above, it is important to keep in mind the meaning of the two cutoffs used. A score of 85, one standard deviation below the mean, represents the lower bound of the “average range.” Scores below 85 are quite low. In contrast, a score of 100 is the national average. As mentioned above, we would expect only half of children to score above this cutoff. DPP leadership uses both of these cutoffs as indicators of levels of children’s readiness for school. The cutoff of 85 is considered possibly too low for the definition of school ready (i.e., that merely exceeding the threshold for being “at risk” should not constitute the definition of “ready for school”). Further, adopting the cutoff of 100 seemed stronger as a readiness goal, but questions still remain about its appropriateness. (For instance, is requiring that children score “above average” too stringent a criterion for defining “ready for school,” as it is likely that children scoring slightly below average are ready for school?)
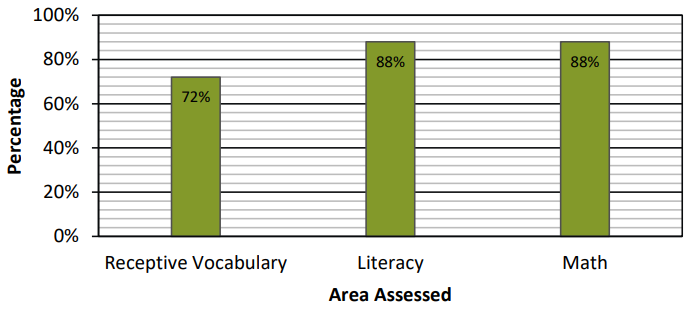
As a compromise, we also considered the cutoff of one half of a standard deviation (i.e., a score of 92.5) below the mean as another potentially useful criterion. Results using this cutoff are presented in Chart 3. In the general population, one would expect 69% of children to meet or exceed this threshold. For receptive vocabulary, nearly three-quarters of children met or exceeded this threshold in at least one language. For literacy and math, about 88% of children met or exceeded this threshold.
Chart 3. Weighted Percent of Children Scoring 92.5 or Above on Spring Standardized Assessments in Spanish or English
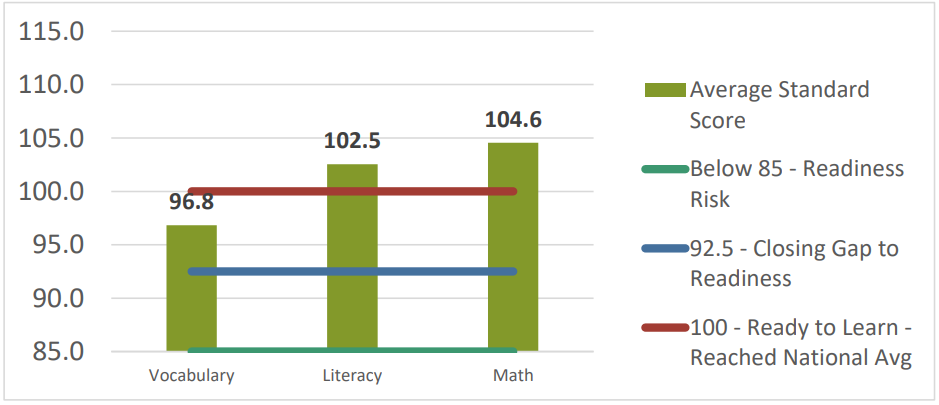
Showing these benchmarks and measures all together provides an overview of children’s school readiness at different levels. Chart 4 show DPP average standard scores for the spring.
Chart 4. DPP Average Standard Scores – Spring 2015 (National Average = 100)
Parent and Teacher Surveys
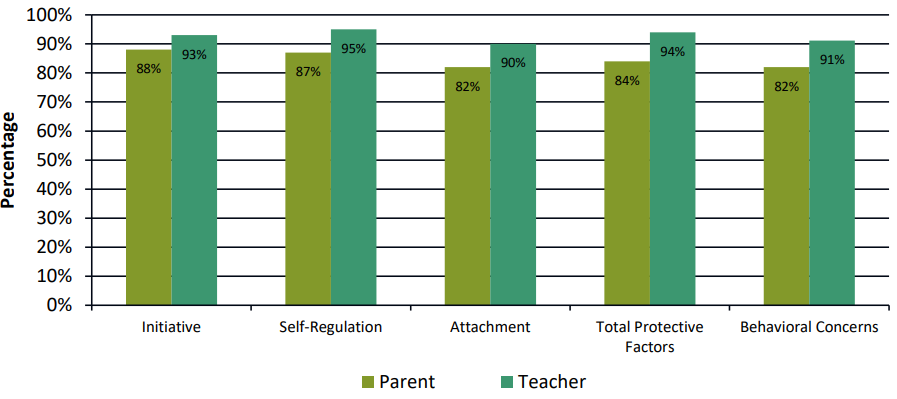
For the DECA, readiness is defined as being in the “Typical” or “Strength” categories as defined by the publisher. For Protective Factors, children with T-scores greater than 40 fall into these categories. For Behavioral Concerns, higher scores indicate greater levels of behavioral concerns, so children with Tscores below 60 are considered in the “Typical” range. In the general population, one would expect about 84% of children to fall within these ranges. As displayed in Chart 5, according to parents, a majority of children were in the typical or strength range for Initiative, Self-Regulation and Total Protective Factors (a combination of Initiative, Self-Regulation and Attachment). Parents rated about 82% of children in the typical or strength range for Attachment and 82% in the typical range for Behavioral Concerns. Teachers also rated a majority of children in the typical or strength range for Initiative, Self-Regulation Attachment and Total Protective Factors and over 90% in the typical range on Behavioral Concerns.
Chart 5. Weighted Percentage of Children Scoring in the Average Range or Above on Spring Parent and Teacher DECA Surveys
We examined the differences between teacher and parent ratings using guidelines from the authors of the DECA. The authors developed these guidelines to help users distinguish between differences in scores due to measurement error and differences that are likely due to a meaningful difference between scores. Chart 6 shows the percentages of parents and teachers exceeding difference thresholds. For Initiative, a difference of 10 is needed to conclude that there is a significant difference between the parent and teacher rating. The average difference between teacher and parent reports, 8.9 (SD=7.3), did not exceed this threshold, indicating that, on average, teacher and parent ratings did not differ. For SelfRegulation, a difference of 10 is needed to conclude that there is a significant difference between the parent and teacher rating. The average difference between teachers’ and parents’ reports, 8.6 (SD=6.4), did not exceed this threshold, indicating that, on average, teacher and parent ratings did not differ.
For Attachment, a difference between the teacher’s and parent’s score of 12 is needed to conclude that the scores are significantly different. On average, the difference between the parent and teacher scores, 5.8 (SD=4.4), did not exceed this threshold. For Total Protective Factors, a difference of 7 points is needed to conclude that there is a significant difference between the parent and teacher ratings.
Across the sample, the average difference between ratings for Protective Factors was 9.3 (SD=7.2), which was above that threshold indicating a significant difference. For Behavioral Concerns, a difference of 14 points is needed to conclude that there is a significant difference between the parent and teacher ratings. The average difference in the sample was 9.3 (SD=7.3), which did not reach this threshold.
Chart 6. Comparison of Parent and Teacher DECA Surveys, Weighted
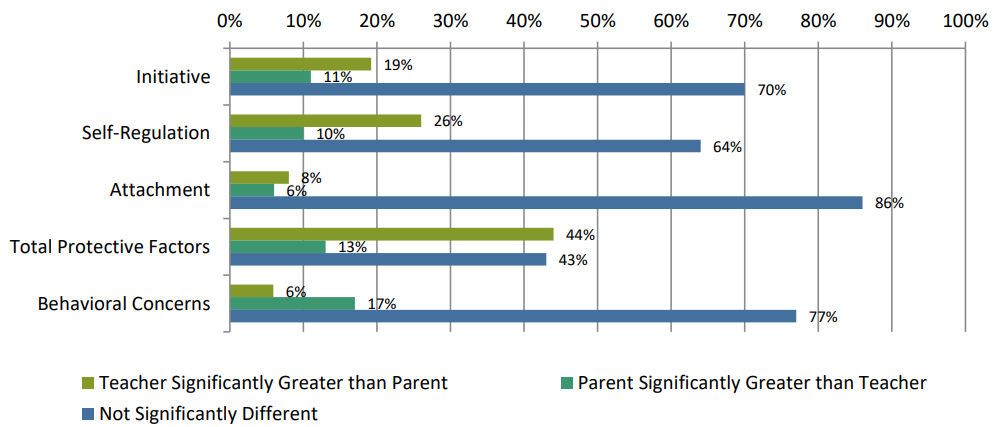
In sum, for Initiative, Self-Regulation and Attachment, teachers and parents made similar ratings for over half of the sample. Teachers rated children significantly higher than did parents more often than parents rated children significantly higher than teachers. For 44% of the sample, teachers rated children significantly higher than parents on Total Protective Factors. For Behavioral Concerns, parents and teachers generally agreed; but when they differed, parents rated the child significantly higher than the teacher.
Cohort 7 Preschool Quality in 2014-2015
Preschool Quality
The 204 children in the sample were enrolled in 107 different preschools. Information regarding quality of these preschools was gleaned from two sources: a) the Qualistar Rating and Accreditation information that DPP incorporates in its calculation of the tuition credit for each child, and b) the classroom observations using the CLASS tool that were conducted specifically for this evaluation project as well as observations that were conducted for the DPP quality rating.18
Qualistar Rating and Accreditation
Within the sample, 110 of the 112 preschools were Qualistar rated. Detailed information about the quality of these preschools was provided to Clayton Early Learning from Qualistar. Figure 1 presents the breakdown of programs by star level. Sixty-two percent of programs had earned 3 stars. Nearly 30% of programs had 4 stars. No preschools earned a provisional rating and no preschools had a rating of one star, indicating that very few programs were of the lowest quality. Two preschools had not yet been rated. One program earned a 4 through NAEYC accreditation.
Chart 7. Qualistar Ratings for Classrooms with DPP Study Participants
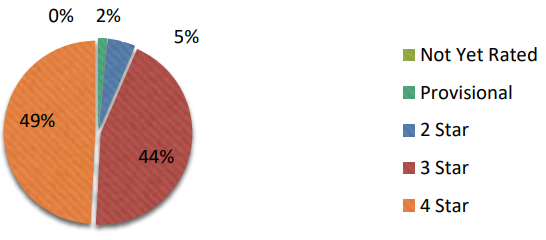
Table 9 presents descriptive statistics for the five component areas of the Qualistar rating for the 61 sites with expanded Qualistar rating data available.19 Sites were strongest, on average, in the areas of Family Partnerships and Adult-to-Child Ratios and Group Size. Family Partnerships was a particularly strong area, with programs earning, on average, 90% of the possible points for this area. While scores in this area covered a wide range (0-10), very few programs earned very low scores on this component. Two programs earned no points for this area. One other programs earned 4 points. The remainder earned between 8 and 10 points. For Adult-to-Child Ratios and Group Size, the average of the programs was relatively high, but there was still some variability around that mean, with scores ranging between 6 and 10.
On average, programs earned about 60% of the possible points for Training and Education. There was considerable variability around this mean with some programs earning very few points and half earning 6 or fewer points of the 10 points possible. Programs earned, on average, about two-thirds of the possible points for Learning Environment. Scores in this area ranged somewhat, with some programs earning 4 points and 8 programs earning all 10 of the possible points. Six programs earned the 2 points for gaining accreditation.
Table 9. Qualistar Rating Components for Programs Attended by Children in the Sample (n=61 programs)
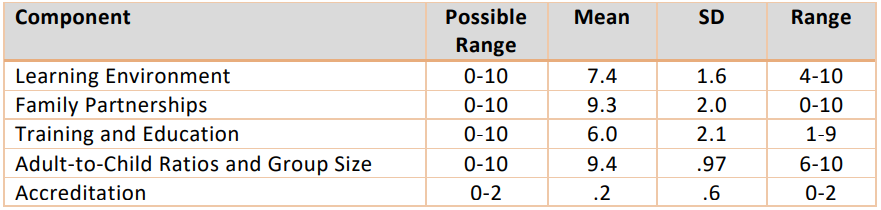
Analyses were conducted to test whether the type of provider (DPS vs. Community) was associated with the components of the Qualistar rating. The two types of programs only differed significantly in one area: Accreditation.20 On average, community preschool programs earned significantly more points than DPS preschools in this area.
CLASS® Observations
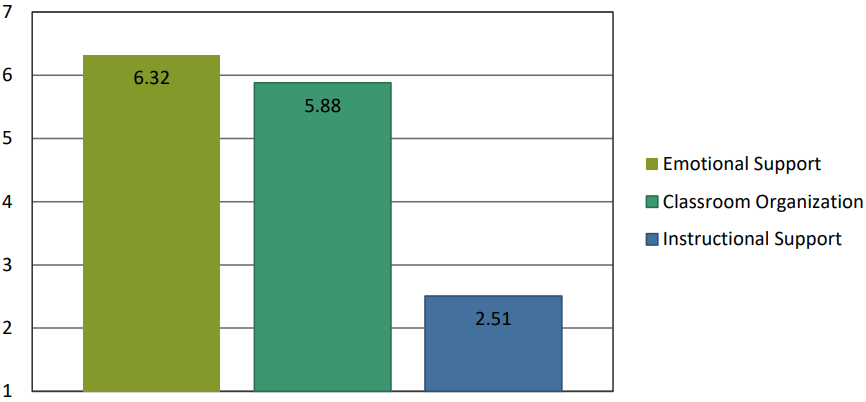
Chart 9 displays the mean scores for the 88 classrooms that were observed using the CLASS® Observation. On average, scores for Emotional Support and Classroom Organization were high, while scores for Instructional Support were near the bottom of the middle-range. Average scores for Emotional Support and Classroom Organization were slightly higher than average scores from previous large studies. As described above, in previous large studies using this observation tool, average scores for Emotional Support tended to be in the 4.5-5.5 range and average scores for Classroom Organization tended to be in the 4.5-5.0 point range. Scores for Instructional Support were similar to what has been observed in previous large studies, which have been in the 2-3 range.
Chart 9. Average CLASS® Domain Scores (n=88 Classrooms)
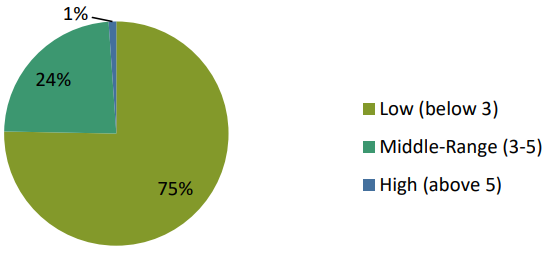
Charts 10, 11, 12 provide information about the variability in these domain scores. For Emotional Support, all classrooms scored in the high range (scores above 5). For Classroom Organization, over 90% of classrooms scored in the high range, no classrooms scored in the low range (below 3), and the remainder scored in the middle-range. For Instructional Support, about three-quarters of classrooms scored in the low range, slightly less than a quarter scored in the middle range, and % of classrooms scored in the high range.
Chart 10. Distribution of Scores for Emotional Support (88=Classrooms)
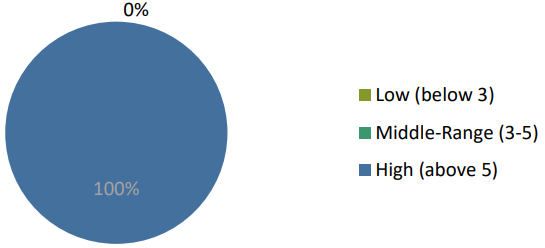
Chart 11. Distribution of Scores for Classroom Organization (n=88 Classrooms)
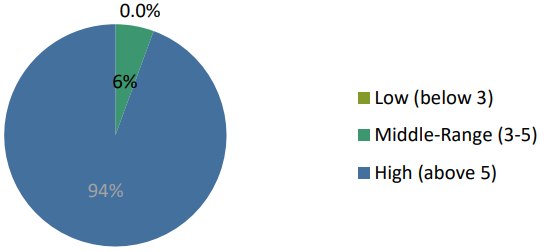
Chart 12. Distribution of Scores for Instructional Support (n=88 Classrooms)
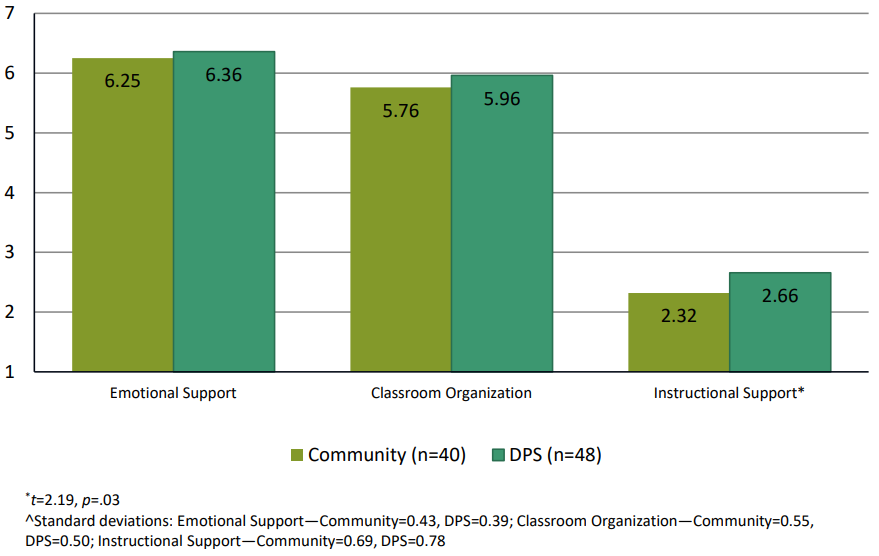
We also conducted analyses to test for differences in CLASS® domain scores by provider type. The results of these analyses are presented in Chart 13. Scores for all CLASS® subscales were not statistically different, on average, for DPS classrooms compared with community-based preschool classrooms except for the domain of instructional support in which DPS scores are significantly higher (DPS average=2.67, SD=.78; community average=2.32, SD=.69). 21
Chart 13. CLASS® Domain Scores by Provider Type
Does Quality Impact Child Outcomes?
For this analysis, we focused on the CLASS® Observation data when examining the association between preschool quality and child outcomes. However, there was very little variability in the Emotional Support domain (see Chart 10), and Classroom Organization (Chart 11) and so we focused on Instructional Support only. To examine the association between quality and child outcomes we computed partial correlations between spring assessment scores and CLASS® domain scores, controlling for fall assessment scores. These analyses, while not specifically focused on change over time (i.e., the actual difference between fall and spring scores), examine “residualized gain,” which can be understood as how children score in the spring after taking into account the differences between them in the fall.
For the English academic assessments, there was a significant correlation between spring math scores and the instructional support score; but none was found for vocabulary, literacy, nor executive function scores. There was also a significant correlation for spring Spanish literacy and instructional support. No significant associations were observed for the spring teacher DECA ratings and any of the CLASS® domains after controlling for fall ratings.
Summary Findings
Do children make progress in their development while in DPP early childhood environments (i.e., language, literacy, mathematics, and social-emotional development)?
- Significant increases were found for vocabulary and for literacy (small in magnitude, about a fifth of a standard deviation). For math, there was no significant change. It is important to keep in mind that these scores are adjusted for age, so when increases are observed, they are above and beyond what one would expect due to typical maturation.
- For assessments administered in Spanish, there was a moderate increase in Spanish vocabulary and Spanish literacy scores over the course of the school year, about a quarter to a third of a standard deviation. No difference was observed for math administered in Spanish from fall to spring
- No significant increase was observed for executive function, however children’s results reflected the national average by spring. Fall sustained attention was associated with stronger spring English literacy and math scores.
- Significant improvements were also observed in two of the teachers’ ratings of social emotional development over the course of the school year. Change over time was significant and positive for the protective factor “Initiative”, as well as for Total Protective Factors. No significant decreases in Behavioral Concerns over the course of the school year were reported.
To what extent and in what areas are children enrolled in DPP, ready for kindergarten?
- School readiness is gauged at several different benchmarks for the standardized assessment scores. A standard score of 85 is one standard deviation below the mean of 100, and we expect that over 84% of children in the general population would scores above an 85.
- Over 95% of children whose primary language was English scored 85 or above on English vocabulary as compared with 36% of children whose primary language was not English. A different pattern was observed for literacy and math with more non-English speakers reaching scores above 85 than previous years.
- A standard score of 100 is the national mean, and we would expect that 50% of children in the general population would score at or above this level.
- For English vocabulary, for instance, three-quarters children whose primary language was English (73%) earned a score of 100 or greater as compared with just 9.5% of children with another primary language. For English literacy, 75% of children whose primary language was English scored 100 or greater as compared with 39% of children with another primary language. Finally, for math, 77% of children whose primary language was English earned scores of 100 or above compared with 45% of children whose primary language was something other than English.
- By spring, over 90% of children score in the strength and typical range for each of the social emotional domains (Total Protective Factors and Behavioral Concerns).
Do children from different income levels and with different primary languages make similar progress in their development while in DPP early childhood environments?
- Income tier and child’s primary language are strongly associated. Nearly all children whose primary language is not English are from Tiers 1 or 2 whereas only about 42% of the children whose primary language is English are from these lowest two tiers. As a result, in this sample, it is impossible to disentangle the effects of income and primary language and any effects observed are possibly the result of the co-occurrence of these two factors.
- Children whose primary language was English scored over two standard deviations higher (also statistically significant) on vocabulary than their counterparts with another primary language.
- For math and literacy, children whose primary language was English scored close to one standard deviation higher on average than their counterparts with a different primary language (statistically significant).
- No differences by language were observed for LAS (executive function) in the fall. A similar pattern of findings was observed in the spring round.
- The rate of change over time does not differ based on income or primary language, except in the case of math – non-English speakers increased at a higher rate than English speakers.
Does quality impact child outcomes?
- Quality was associated with a few child outcomes. Significant correlations were found between the instructional support scores on CLASS and spring English-administered math scores, as well as for spring Spanish literacy scores after controlling for fall ratings.
Supporting Documentation
- Roid, G. H., Miller, L. J., Pomplun, M., Koch, C. (2013) Leiter-3: Leiter International Performance Scale-Third Edition. Subtest: Attention Sustained. Stoelting Company, Wood Dale, IL Cat. No. 34100M. www.Stoelingco.com
- Dunn, L. M., & Dunn, D. M. (2007). Peabody Picture Vocabulary Test, Fourth Edition. Minneapolis: Pearson Assessments.
- Dunn, L. M., Lugo, D. E., Padilla, E. R., & Dunn, L. M. (1986). Test de Vocabulario en Imagenes Peabody (TVIP). Minneapolis: Pearson Assessments.
- Woodcock, R. W., Schrank, F. A., Mather, N., & McGrew, K. S. (2007). Woodcock-Johnson III, Tests of Achievement (Normative Update). Rolling Meadows, IL: Riverside Publishing.
- Muñoz Sandoval, A. F., Woodcock, R. W., McGrew, K. S., & Mather, N. (2005). Batería III Woodcock-Muñoz. Rolling Meadows, IL: Riverside Publishing.
- LeBuffe, P. A., & Naglieri, J. A. (1999). Devereux Early Childhood Assessment, User’s Guide. Lewisville, NC: Kaplan.
- For analyses of assessments administered in Spanish, a two-level income tier group variable was used omitting the categories ‘tiers 3-5’ and ‘tier 6’ because only three child assessed in Spanish fell into tiers 3-5 and one children assessed in Spanish fell into tier 6.
- x25 = 46.53, p<.0001
- ANOVA (Analysis of Variance) is a statistical technique that compares mean scores for specified groups. Repeated Measures ANOVAs take into account scores at multiple points in time. This analysis compares the amount of change over time for specified groups.
- It does not make sense to conduct this set of analyses for assessments administered in Spanish, since there is not adequate variability in children’s primary language among children assessed in Spanish.
- F=4.966, p=.027, eta2=.025
- x21 = 82.73, P<.0001
- x21 = 11.77, P<.001
- x21 = 17.38, P<.0001
- x21 = 75.76, P<.0001
- x21 = 25.13, P<.0001
- x21 = 21.63, P<.0001
- It is important to keep in mind that all of the preschool quality information provided here is based on only a sample of preschools where the children in the study sample were enrolled. For information on the quality of all preschool programs participating in DPP during the 14-15 school year, readers are referred to the annual evaluation report prepared by Augenblick, Palaich and Associates.
- More information about the five component areas of the Qualistar rating is available at: http://www.qualistar.org/qualistar-ratingcomponents.html. Data were provided for only 89 of our 110 rated sites.
- t=2.75, df=24, p=.011
- Emotional Support—t=1.25, df=87, p=n.s.; Classroom Organization—t=1.85, df=87, p=n.s.; Instructional Support—t=2.19, df=87, p=.03