Cohort 9 Report
Denver Preschool Program
Child Outcomes Study 2016 – 2017
Part A
Preschool Progress and Kindergarten Readiness Report,
Cohort 9
Document Summary
This report describes short-term outcomes on Cohort 9 of the Denver Preschool Program Child Outcome Study. Specifically, the progress children made over the preschool year and kindergarten readiness. The Cohort is a stratified sample comprised of 241 randomly selected children who participated in DPP during the 2016-2017 school year. The outcomes focus on pre-academic and cognitive skills and social-emotional development. Subgroup comparisons by primary language and income are included, as well as details on the effects of high-quality preschool settings.
 Clayton Early Learning Research and Evaluation Department
 Clayton Early Learning Research and Evaluation Department
 Research Contacts:
Sheridan Green, Ph.D., Vice President, Research and Evaluation, sgreen@claytonearlylearning.org
Diana Mangels, M.A., Director, Research and Evaluation, dmangels@claytonearlylearning.org
Recommended Citation:
Green, S., Mangels, D. & Reale, M. (2018). Denver Preschool Program Child Outcomes Study 2016-2017: Part A:
Preschool Progress and School Readiness Report, Cohort 9. Denver, CO.
Executive Summary 2016-2017, Cohort 9
Do children make developmental progress while participating in DPP?
- Average standard scores on the standardized measures increased slightly for all pre-post comparisons over the course of the year. No statistically significant changes were observed from fall to spring on the English vocabulary or early literacy measures this year.
- In 2016-2017, a statistically significant increase was found for early math administered in English.
- For assessments administered in Spanish, there was a statistically significant increase in Spanish literacy scores over the course of the school year, (about a 1/3 of a standard deviation or about 5 points). No difference was observed for vocabulary (with either the TVIP or the new WM Picture Vocabulary test) administered in Spanish from fall to spring. No statistically significant increases were observed for early math administered in Spanish.
Do children from different income levels and with different primary languages make similar developmental progress while in DPP?
- Income tier and child’s primary language are strongly associated. For this cohort, 75% of children whose primary language is not English are from Tiers 1 or 2, whereas only about 40% of the children whose primary language is English are from these lowest two tiers. As a result, in this sample, it is impossible to disentangle the effects of income and primary language and any effects observed are possibly the result of the co-occurrence of these two factors.
- As was found last year, children whose primary language was English scored over two standard deviations higher (in both fall and spring; also statistically significant) on English vocabulary than their counterparts with another primary language.
- For math and literacy, children whose primary language was English scored close to one standard deviation higher on average than their counterparts with a different primary language (fall and spring; statistically significant). However, rates of growth did not differ significantly by primary language.
To what extent and in what areas are DPP children ready for kindergarten?
- The vast majority (82-86%) met the kindergarten readiness benchmark. As a whole group (whether achieved in Spanish or English), 88% scored over 85 in vocabulary, 82% in literacy, and 86% in math. The average standard scores for this cohort of students were 100 for vocabulary, 92 for literacy, and 95 for math (recall the national mean = 100).
- About 95% of children whose primary language was English, scored 85 or above on English vocabulary as compared with 42% of children whose primary language was not English. In 2016- 2017, about half of non-primary English speakers reached scores above 85 in literacy (51%) and math (54%), which are lower percentages than were found for previous cohorts.
- Children with a primary language other than English fared a little better on early literacy and math administered in Spanish. Almost 80% scored over 85 on the early literacy and 74% scored above 85 on the math administered in Spanish. For vocabulary, about half the children (50% on the WM Picture Vocabulary and 53% on the TVIP) scored above 85.
- In spring, over 90% of children scored in the strength and typical range for each of the social-emotional domains (Total Protective Factors and Behavioral Concerns) rated by teachers. Parents rated about 85% of children in the typical or strength range for Self-Regulation and 77% in the typical range for Behavioral Concerns.
- For executive function factors measured by the CHEXI for this cohort, parents rated 80% of children in the adaptive range for Working Memory (e.g., remembering instructions, remembering several things asked to do) compared with 75% rated by teachers. Parents rated 67% of children to be in the adaptive range for Inhibition (e.g., thinking first, then acting; being able to stop an activity when asked) compared with 81% of teachers.
Does the classroom environment make a difference in progress and kindergarten readiness for DPP children?
- For this cohort, very small associations were observed between the CLASS® instructional support domain scores and children’s social-emotional total protective factor scores (positive association with parent ratings and a negative association with teacher ratings). This means that parents who rated children as having higher protective factors were those whose children attended classrooms with higher CLASS® scores. In addition, Colorado Shines ratings were very slightly negatively associated with the English vocabulary scores.
Introduction
The Denver Preschool Program (DPP) is a taxpayer-funded initiative, created in 2006 and reauthorized by voters in 2014, that champions, funds, and increases access to high-quality preschools. DPP supports every family in Denver with a 4-year-old by offering tuition credits to access a high-quality preschool of their choosing and gives approved providers quality improvement resources. The vision of DPP is that children in Denver enter kindergarten ready to reach their full potential.
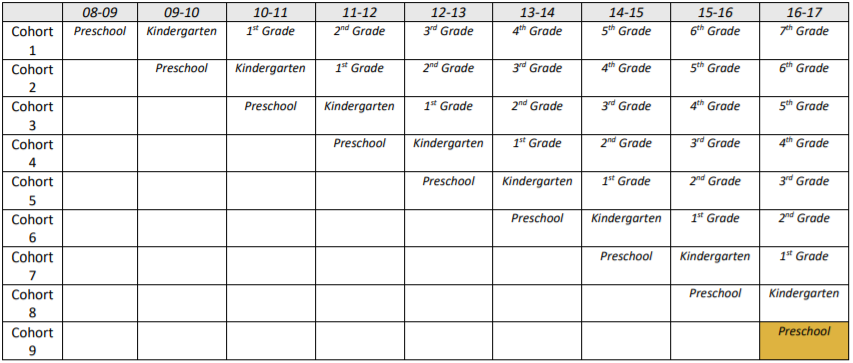
The Clayton Early Learning Research and Evaluation Department conducts a cross-sequential study, which gathers year-of and longitudinal data for each DPP cohort. The study started during the 2008-2009 school year and has continued every year uninterrupted. The study helps DPP understand child progress during preschool, kindergarten readiness, and the impact of receiving tuition credits on academic outcomes through the end of high school. During the 2016-2017 school year, the research team welcomed Cohort 9 and Cohort 1 was expected to be enrolled in seventh grade (see Table 1).
The enclosed report focuses on the short-term outcomes; progress made during the preschool year and kindergarten readiness, in the areas of vocabulary, early literacy, math, and social-emotional and cognitive development. A companion report, Denver Preschool Program Child Outcome Evaluation 2016–2017: Part B: Longitudinal Follow-up, Evaluation Cohorts 1-8 Elementary Report, describes the long-term outcomes.
Table 1. DPP Evaluation Cohorts and Expected Grade Levels by School Year
Short-Term Child Outcome Questions
- Do children make progress in their development while in DPP early childhood environments (i.e., language, literacy, mathematics, and social-emotional development)?
- Do children from different income levels and with different primary languages make similar progress in their development while in DPP early childhood environments?
- To what extent and in what areas are DPP children ready for kindergarten?
Data Collection and Measurement
The study involves a tremendous amount of coordination, partnerships, and collaboration to collect direct child assessments, parent and teacher reports, and classroom observations. At the beginning of the school year, the research team identifies a stratified and representative group of children and randomly selects a sample. Parents of selected children are contacted by the research team and are invited to participate in the study. The researchers also invite lead teachers of selected children to participate in providing information on the child and the classroom environment. Parents and teachers are compensated for their time with a $20 gift card. Parents also receive a short report on the results of their child’s direct assessments.
Direct Child Assessments
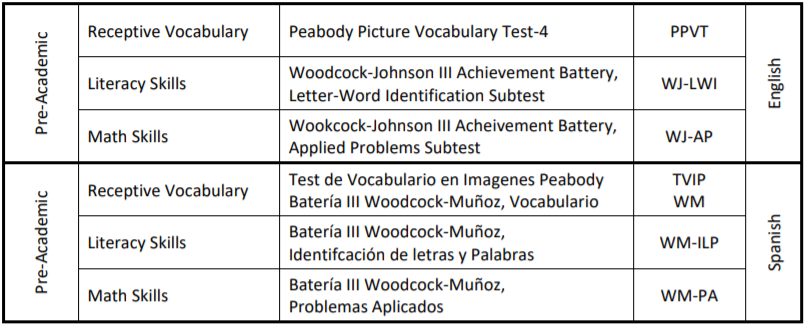
Because of the rapid growth that happens during the first five years of life and the group atmosphere of the classroom, it is often difficult to know how an individual child is developing without a direct child assessment. The research team uses direct assessment to assess receptive vocabulary, early literacy, and math abilities for standard English and Spanish languages (see Table 2).
Table 2. Direct Child Assessments
Children take part in direct child assessments in the fall and again in the spring. Highly trained research assistants conduct the assessments at the child’s school in an area designated by the child care center. The children and assessors generally sit in a quiet space at a child’s size table outside the busy classroom. The assessments are spaced about four-to-five months apart and are conducted in English for all children regardless of their primary language. Spanish-English dual language learners take additional assessments in Spanish at both time points.
The standard scores are used for every direct child assessment. Scores are based on a representative sample for each age and can range from 0 to 150, with an average score of 100 and a standard deviation of 15. Standard scores are helpful for interpreting changes in scores exhibited across the year because these scores are based on age. Scores that are steady from fall to spring tell us that the child had a steady rate in development. However, if a child were learning above and beyond what we would expect due to typical development, a significant change in scores from fall to spring would reflect accelerated development.
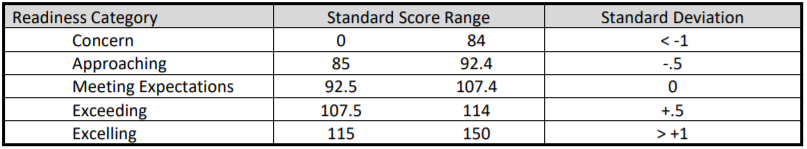
The standard score is also useful for understanding readiness in the spring before children enter kindergarten. We would expect a typically developing child to have a score of 100, thus meeting the expectation for their age. The cutoffs for “concerns” or a child not reaching a proficiency level for their age can be determined based on the standard deviation from the score of 100. In this study, five categories of readiness were derived: Concern, Approaching, Meeting, Exceeding, and Excelling (see Table 6).
Table 6. Readiness categories that determine kindergarten proficiency level
Parent and Teacher Reports
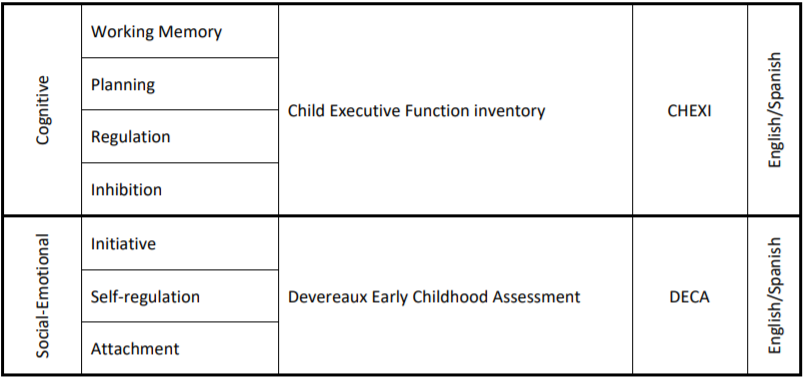
Social-emotional development and cognitive skills require a more in-depth and background knowledge of the child that is hard to capture in a one-off direct child assessment. For these domains (see Table 7), the researchers rely on reports from important adults in the child’s life: parents and teachers. Parents and teachers fill out child reports during the fall and spring around the same time that the direct child assessments occur.
The T-scores are used for parent and teacher reports. The average T-score is 50 and a standard deviation of 10. The interpretation of the scores still allows comparison of growth over time and deriving benchmarks of proficiency similar to the standard scores in the direct child assessments.
Table 7. Teacher and Parent Reports
Classroom Observations
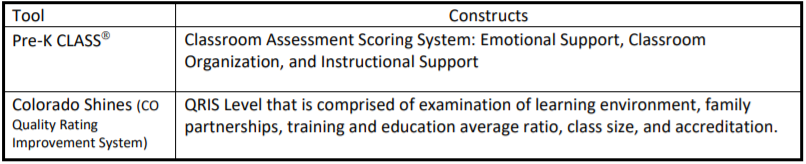
Highly trained and reliable observers conduct classroom observations in every classroom that holds a DPP student study. In certain circumstances, the research team uses secondary data/retrospective scores for the classroom observation data (see Table 8). Teachers also provide information about their classroom, curriculum, and teaching credentials and have the opportunity to have an in-depth consultation about his or her results.
Table 8. Classroom Observation Tools
Cohort 9 Snapshot
There were 241 DPP students in Cohort 9 who participated in the child outcomes study. Sample children were 5.2 years of age in May 2017 and 49.8% female. Full sample demographics are provided in Appendix A. About half of the sample (n=121) attended community schools and the other half (n=120) attended Denver Public Schools (DPS). DPP students’ participation status at enrollment breaks down as follows: 20.3% extended day, 58.1% full day, and 21.6% part day.
The sample was distributed across 116 DPP providers, in 168 classrooms, and 176 teachers.
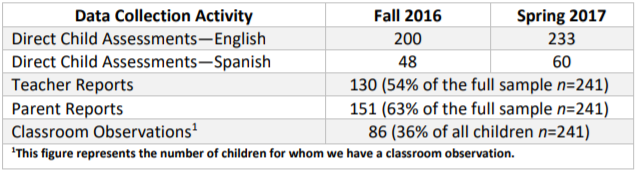
Data was collected for 200 children in the fall and 233 in the spring. Eight students (4%) in fall dropped out before the spring data collection, typically because they moved out of the DPP service area. Data was collected for the 192 children returning from fall, and with an additional 41 new participants in the spring to maximize numbers for follow-up in elementary school (see Table 9).
Table 9. Sample Sizes by Data Collection Type, Fall 2016 and Spring 2017
To maximize the conclusions we can draw about both community DPP sites and those sites in Denver Public Schools (DPS), we stratified our sample by type of provider. The result was two samples: a sample of children in community sites and a sample of children in DPS sites. Both of these samples were representative of the population of children in each type of preschool at the time of sampling. For all nine analyses on the sample as a whole, sampling weights were applied so that the results would be representative of the population of children enrolled in DPP at the time of sampling. For analyses comparing DPS and community sites, weights were not applied.
Key Findings
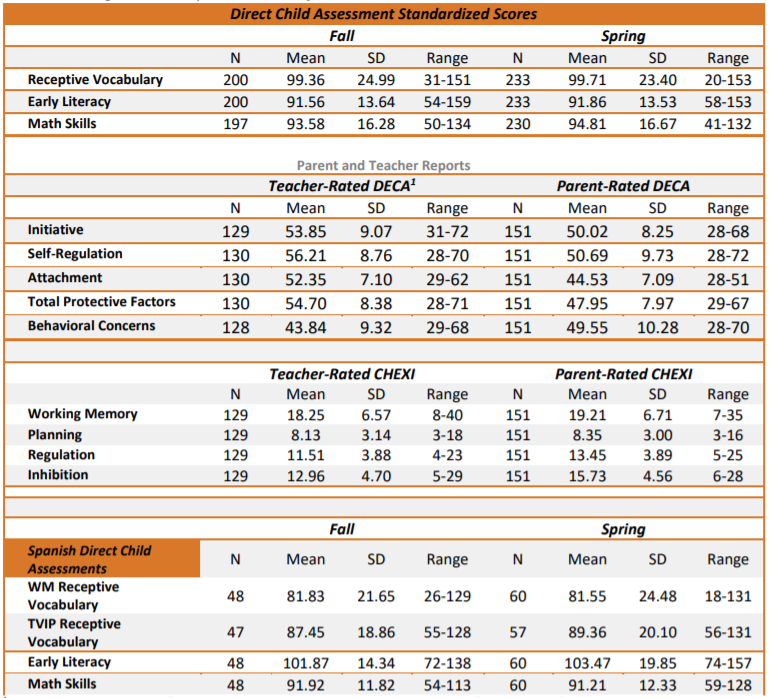
In general, the majority of children scored 85 or above (approaching to excelling proficiency categories) on English child assessments in both the fall and spring. The same was true for Spanish child assessments with the exception of receptive vocabulary. On average, the score for the Woodcock-Muñoz receptive vocabulary assessment (WM Picture Vocabulary) was slightly lower than the TVIP measure of receptive vocabulary. It is noteworthy that for all of these direct child assessments, there is considerable variability in children’s scores, with some individual children scoring quite low and some scoring rather high. Weighted descriptive statistics and ranges are displayed in Table 10.
Table 10. Weighted Descriptive Statistics for Child Outcome Measures
Do children make progress in their development while in DPP early childhood environments (i.e., language, literacy, mathematics, and social-emotional development)?
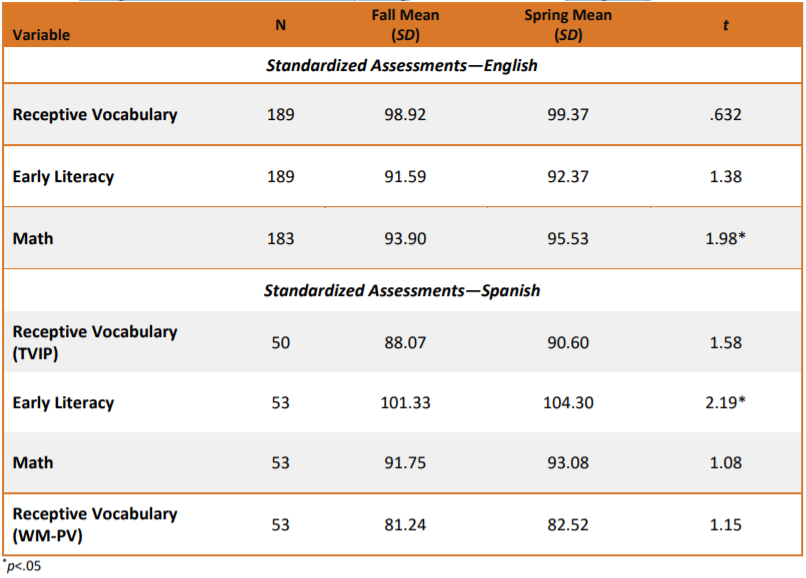
Paired t-test analyses revealed that children had steady scores across the year for English receptive vocabulary and early literacy. This indicated that children were developing at a steady rate that is typical for their age. There was a statistically significant increase in scores of about two points for math skills assessed in English. This suggests that children learned math skills in English, at a rate above what is expected with typical maturation.
Analyses for Spanish assessments showed steady scores for receptive vocabulary and math but a significant increase in scores for early literacy. The increase in standard scores for early literacy was by nearly three points. This means that Spanish-English dual language learners learned early literacy skills in Spanish, beyond what is expected due to naturally growing older. The full results are displayed in Table 11.
Table 11. Change in Child Outcome Variables During the Preschool Year (Weighted)
Do children from different income levels and with different primary languages make similar progress in their development while in DPP early childhood environments?
Overall, children from different income levels are progressing at similar rates across the year on English direct assessments. There is evidence that Spanish-English dual language children from lower incomes are making accelerated gains in Spanish receptive vocabulary as compared to children from higher incomes.
Change Over Time by Income Tier
A series of Repeated Measures ANOVAs1 was conducted with income tier group predicting scores over time on assessments administered in English and Spanish. For Cohort 9, a significant income tier by time interaction was found for the TVIP Spanish receptive vocabulary2 , meaning that children from different income tiers improved at different rates. Children (n=24) in income tier 1, increased their scores by about 5 points, while children in income tier 2 (n=11) showed a statistically significant decrease in scores by over 6 points. The small sample size warrants a cautious interpretation of these findings.
TVIP Spanish Receptive Vocabulary Income Tier by Time Interactions
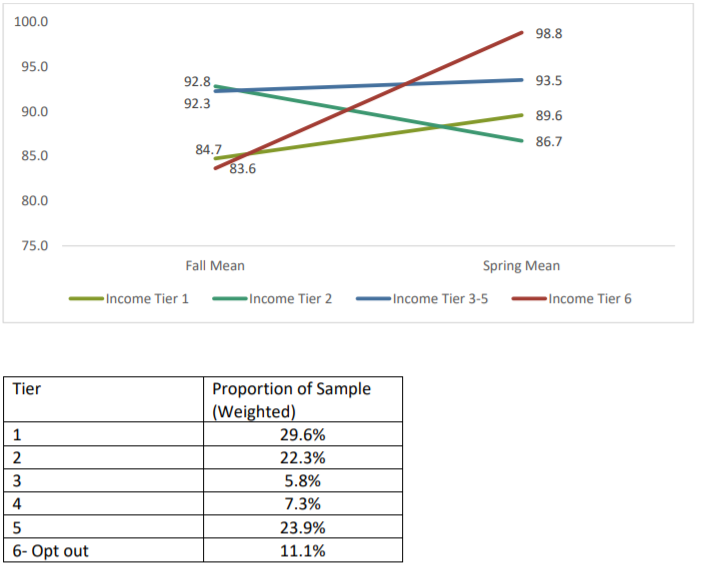
This year, the researchers also used the WM Picture Vocabulary assessment as a possible replacement for the TVIP. These assessment scores did not show a tier by time interaction (i.e., rates of change did not different by income tier).
No other significant interplays between income tier groups and time were shown for any of the other direct assessments. The non-significant income tier by time interactions indicate that children progressed similarly in these areas over the course of their preschool year, regardless of their income tier.
Change Over Time by Children’s Primary Language
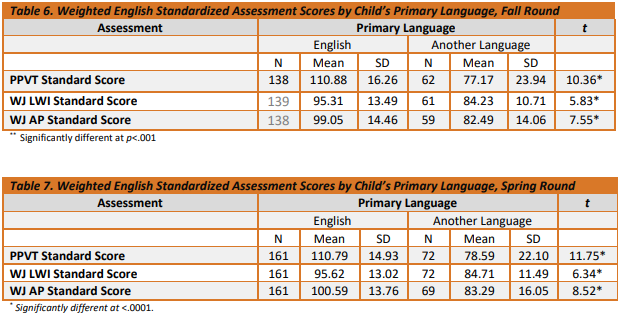
Since all children were assessed in English, regardless of their primary language, it is useful to consider whether children’s scores on the English assessments differed based on whether children spoke English as their primary language or whether they were dual language learners. We performed t-tests to examine whether there were differences in mean scores on the English direct child assessments by primary language group (i.e., English vs. any other language). Results for fall are presented in Table 6. In the fall and spring, there were statistically significant differences found in vocabulary, early literacy, and math assessment scores between English-only and dual language learners.
As a whole, dual language learners consistently scored lower on the English vocabulary, early literacy, and math assessments than English-only children. In the spring, dual language learners, on average, scored 32.2 points lower than English-only children on the English receptive vocabulary assessment.
On literacy and math assessments, children whose primary language was English scored close to one standard deviation higher on average than their counterparts with a different primary language in the fall. A similar pattern of findings was observed in the spring round (see Table 7).
A series of Repeated Measures ANOVAs were conducted with primary language predicting scores over time on assessments administered in English.3 No significant interactions were found between primary language group and time for each of the assessments meaning that the rate of change did not differ by language and English and non-English speakers progressed at the same rate. This means that dual language learners were not “catching” up or learning more or less than English only peers during the school year.
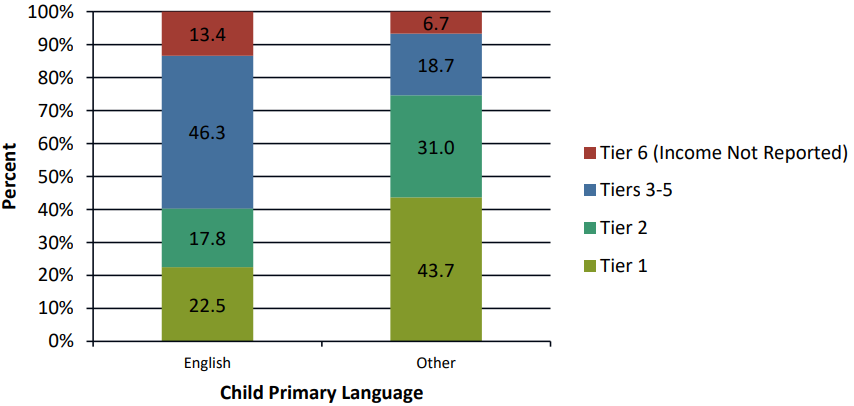
Further analyses were conducted to test whether the extent of the change over time varied by two background characteristics: income tier and children’s primary language. Prior to conducting analyses by income tier, some data reduction/combination was necessary since the number of participants from some of the income tiers was rather small. Income tier was collapsed into a new income tier group variable with four categories: Tier 1, Tier 2, Tiers 3-5 and Tier 6 (i.e., parents who opted out of the requirement to report income and instead elected to automatically be assigned to the lowest tuition credit level).4
It is important to note that these two background characteristics, income tier and child’s primary language, are strongly associated (see Chart 1).5 Three-quarters (75%) of children whose primary language is not English are from Tiers 1 or 2, whereas about 40% of the children whose primary language is English are from these lowest two tiers. As a result, in this sample, it will be impossible to disentangle the effects of income and primary language and any effects observed are possibly the result of the co-occurrence of these two factors.
Chart 1. Income Tier Groups, by Child Primary Language
Cohort 9 Kindergarten Readiness
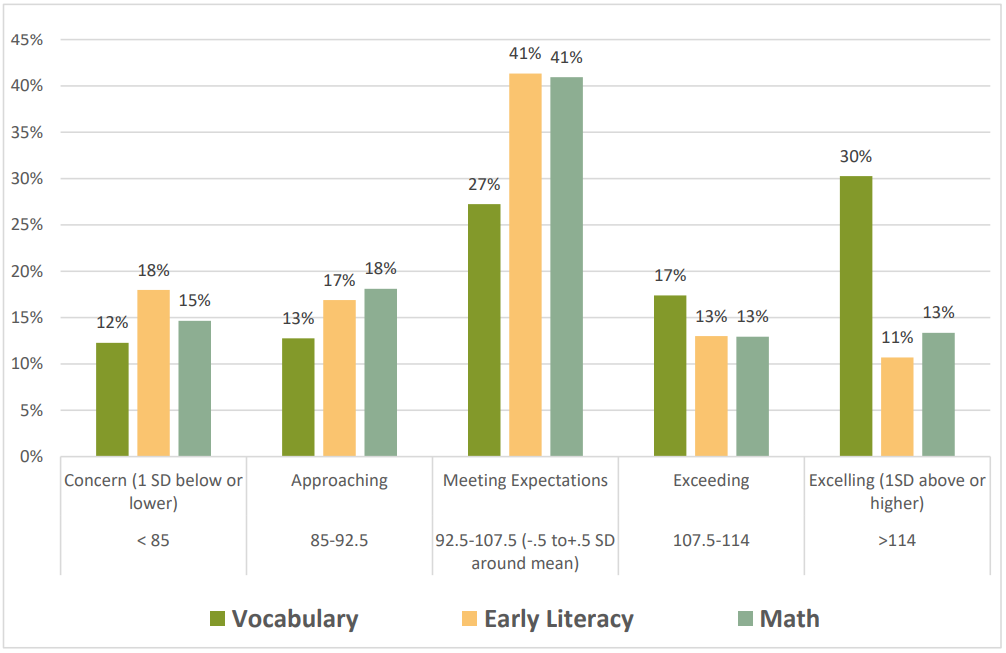
Analyses were conducted to determine how ready for kindergarten DPP students appeared to be at the end of their last preschool year before kindergarten. Readiness was examined in several ways. First, we examined whether children scored in the typical range as defined by the test publishers, namely a standard score of 85 or above. A standard score below 85 indicates being in the risk range for the assessment. While not being at risk when entering kindergarten is important, it is also useful to examine whether children meet a higher standard, defined as scoring at or above 100, the national population mean, on the assessments used in the study. Chart 2 presents the percentage of children scoring 85 or above and 100 or above on each of the assessments at the spring time point. In the general population, one would expect about 84% of children to score above 85 and 50% of children to score above 100.
Analyses revealed that the likelihood of scoring 85 or above on these spring assessments was strongly associated with children’s primary language. About 95% of children whose primary language was English scored 85 or above on the English vocabulary assessment as compared with 42% of children whose primary language was not English.6 Nearly 80% of children whose primary language was English scored 85 or above on English literacy as compared to 51% of children whose primary language was not English.7 Nearly all children whose primary language was English (91%) scored 85 or above on math assessed in English compared with 53.7% of children with another primary language.8
A more pronounced pattern of differentiated results emerged when a score of 100 was used as the cutoff. On English vocabulary, for instance, 79% of children whose primary language was English earned a score of 100 or greater as compared to just 18% of children with another primary language.9 For English literacy, 41% of children whose primary language was English scored 100 or greater as compared with 8% of children with another primary language.10 Finally, for math assessed in English, 53% of children whose primary language was English earned scores of 100 or above compared with 14% of children whose primary language was something other than English.11
For children who took assessments administered in Spanish, proportions scoring above a standard score of 85 improved. Almost 80% of children scored 85 or above on Spanish literacy and 74% of children scored 85 or above on math. Over 50% of children scored 85 or above on Spanish vocabulary WM Picture Vocabulary assessment, while 53% of children scored 85 or above on the TVIP assessment.
Using the threshold score of 100, about 20% met or exceeded the score on vocabulary (WM Picture Vocabulary), while over a third of children scored 100 or above on the other vocabulary measure, the TVIP. About 58% scored 100 or above in Spanish literacy, and only 19% of all children scored 100 or above on math skills assessed in Spanish. All of these assessments were normed with monolingual children who were learning only one language. Language development for children learning two languages is expected to progress at a different pace than for children learning one language. One way to address the instrumentation limitations in understanding the progress of dual language learners is to look at bilingual children’s scores in both languages.
A variable was constructed to indicate whether children met or exceeded the two cutoff scores (85 and 100) in at least one language for each standardized test. Children who were bilingual could meet this criterion by meeting or exceeding the cutoff in either language. Children who were only assessed in English had only one opportunity to meet or exceed the cutoff. The results of this analysis are presented in Chart 2. 88% of children met or exceeded the cutoff of 85 in at least one language in the area of receptive vocabulary (i.e., PPVT or WMPV). 82% of children met or exceeded the cutoff of 85 in at least one language on the literacy assessment (WJLWI or WM-LWI) and 86% on either of the math assessments (WJ-AP or WM-AP). When a score of 100 was used as a cutoff, 63% of children met or exceeded this benchmark for vocabulary; 43% met or exceeded this benchmark for literacy and also 43% for math.
Chart 2. Weighted Percentage of Children Scoring in the Average Range or Above on Spring Standardized Assessments in Spanish or English 2016-2017
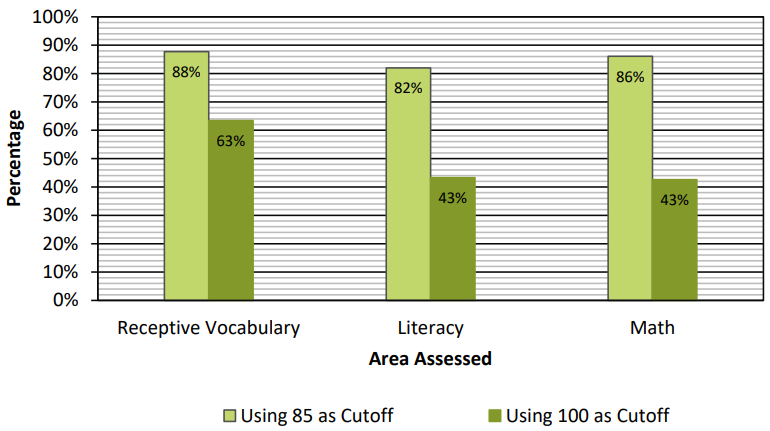
When considering the analyses reported above, it is important to keep in mind the meaning of the two cutoffs used. A score of 85, one standard deviation below the mean, represents the lower bound of the “typical range.” Scores below 85 are quite low. In contrast, a score of 100 is the national average. As mentioned above, we would expect only half (50%) of children to score above this cutoff. DPP leadership uses both of these cutoffs as indicators of levels of children’s readiness for school. The cutoff of 85 is considered possibly too low for the definition of school ready (i.e., that merely exceeding the threshold for being “at risk” should not constitute the definition of “ready for school”). Further, adopting the cutoff of 100 is stronger as a readiness goal, but questions still remain about its appropriateness. (For instance, is requiring that children score “above average” too stringent a criterion for defining “ready for school,” as it is likely that children scoring slightly below average are ready for school?)
Showing both of these benchmarks and measures all together provides an overview of children’s school readiness at different levels. Chart 3 shows DPP average standard scores on the English assessments for the spring administered to all DPP children. Results indicate that DPP students are meeting the national average for English vocabulary and approaching the average for literacy and math. Note, this includes the scores of dual language learners and those for whom English is the only primary language.
Chart 3. Proportion by Proficiency Level (Spring 2017) Best Score as Tested in Either English or Spanish
Parent and Teacher Ratings of Social Emotional Development
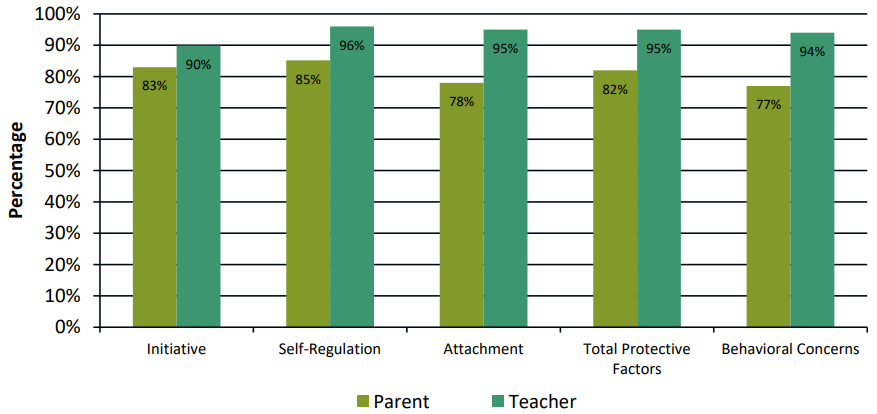
For the DECA, readiness is defined as being in the “Typical” or “Strength” categories as defined by the publisher. The DECA is scaled using T-scores, which have a mean of 50 and a standard deviation of 10. I For Protective Factors, children with T-scores greater than 40 fall into these categories. For Behavioral Concerns, higher scores indicate greater levels of behavioral concerns, so children with T-scores below 60 are considered in the “Typical” range. In the general population, one would expect about 84% of children to fall within these ranges.12
As displayed in Chart 4, according to parents, a majority of children, though fewer than expected, were in the typical or strength range for Initiative, Attachment, and Total Protective Factors (a combination of Initiative, Self-Regulation and Attachment). Parents rated about 85% of children in the typical or strength range for Self-Regulation and 77% in the typical range for Behavioral Concerns (i.e., the typical range includes those experiencing fewer behavior concerns than those in the concerning range). Teachers also rated a majority of children in the typical or strength range for Initiative, Self-Regulation Attachment and Total Protective Factors and over 90% in the typical range on Behavioral Concerns. In the spring, teachers rated children (as a group) slightly higher than the national average of 50 on all of the subscales. Spring parent ratings of children were (as a group) also close to the national average, with slightly lower scores on Attachment. Once again, there was substantial variability in all of the scores (see ranges listed in Table 5).
Chart 4. Weighted Percentage of Children Scoring in the Average Range or Above on Spring Parent and Teacher DECA Surveys 2016-2017
We examined the differences between teacher and parent ratings using guidelines from the authors of the DECA. The authors developed these guidelines to help users distinguish between differences in scores due to measurement errors and differences that are likely due to a meaningful difference between scores. Chart 5 shows the percentages of parents and teachers exceeding difference thresholds. For Total Protective Factors, a difference of seven points is needed to conclude that there is a significant difference between the parent and teacher ratings.
Across the sample, the average difference between ratings for Protective Factors was 6.9 (SD=11.1), which was slightly under the threshold, indicating a significant difference between raters. For Behavioral Concerns, a difference of 14 points is needed to conclude that there is a significant difference between the parent and teacher ratings. The average difference in the sample was 5.8 (SD=13.5), which did not approach this threshold.
Chart 5. Comparison of Parent and Teacher DECA Surveys, Weighted, 2016-2017
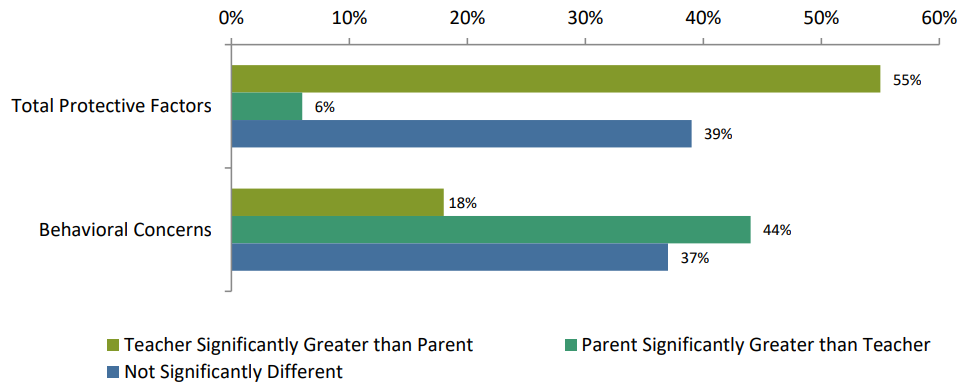
While parent ratings were sometimes significantly higher than teachers, overall teachers were more likely to rate children significantly higher than parents. For 55% of the sample, teachers rated children significantly higher than parents on Total Protective Factors. For Behavioral Concerns, parents and teachers generally agreed; but when they differed, parents rated the child significantly higher than the teacher.
Parent and Teacher Ratings of Executive Functioning
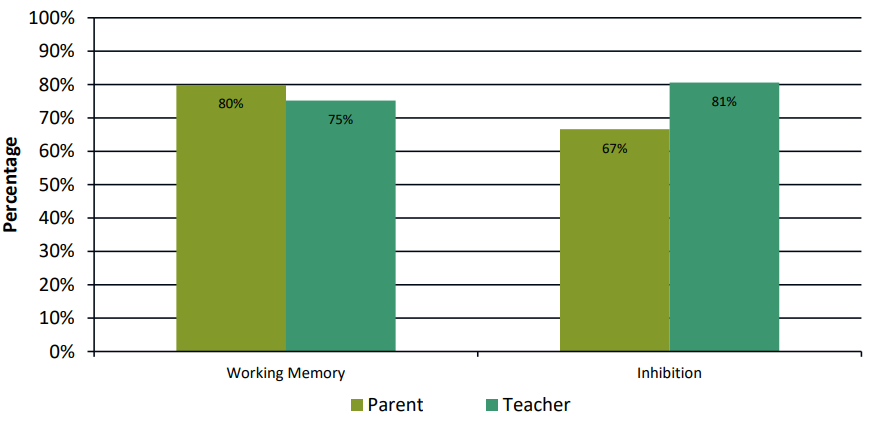
A new measure of executive function was used in the 2016-2017 evaluation, replacing the Leiter International Performance Scale, Third Edition, Attention Sustained Subscale. The new measure, the Childhood Executive Function Inventory (CHEXI; appropriate for ages 4-12), yields 4 subscales that combine into two executive function factor scores. The Working Memory and Planning subscales yield a Working Memory factor, and the Regulation and Inhibition subscales yield an Inhibition factor. This is a relatively new instrument and it has been validated with a number of cross-cultural samples.
On the CHEXI, possible scores can range from 13 to 65 on the Working Memory factor and from 11 to 55 on the Inhibition factor. Lower scores indicate greater levels of executive function (desired levels) in each of these areas. Cutoff scores in use at this time are 34 for Working Memory and 32 for Inhibition (i.e., scores higher than these cutoffs indicate more concerning levels of executive functioning).
Chart 6 shows the proportion of children rated by both parents and teachers, who were categorized into the adaptive executive functioning range. Teachers rated 5% fewer children into the adaptive range on Working Memory than did parents, while teachers rated 14% more children in the adaptive range than parents on the Inhibition factor. Parent and teacher ratings on both sets of proportions are statistically significantly different from each other.13
Chart 6. Percentage of Children in the Adaptive Executive Function Range on Parent and Teacher CHEXI Surveys, Weighted, 2016-2017
Cohort 9 Preschool Quality in 2106 – 2017
Preschool Quality
The 241 children in the sample were enrolled in 116 different preschools. Information regarding quality of these preschools was gleaned from two sources: a) the Colorado Shines Quality Rating Improvement System (adopted in January 2015; CO Shines QRIS) and b) classroom observations using the CLASS® tool that were conducted specifically for this evaluation project as well as observations that were conducted for the ongoing DPP CLASS® ratings.
Colorado Shines Rating
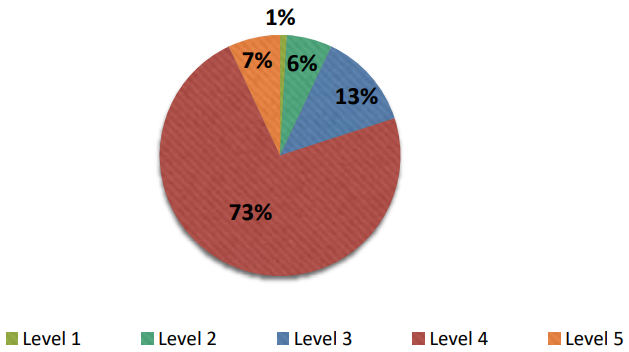
Within the sample, data were available from the Colorado Department of Education for all program sites except one (n=115). These data represent the level quality program from classrooms for 240 of 241 of this DPP student sample. Chart 7 presents the array of programs by quality level. Nearly 13% of programs were rated at Level 3. Nearly 73% of programs were rated Level 4. Nearly 7% of programs were rated Level 5. Only one preschool was rated at a Level 1 designation (licensed) and seven earned a Level 2 rating indicating that very few programs were of the lowest quality.
Early learning programs are rated through Colorado Shines on a scale of 1 to 5:14
- Level 1: Program currently licensed with the State of Colorado.
- Level 2: Program is licensed and in good standing, plus:
- has a quality improvement plan in place
- has conducted the Level 2 Quality Indicator Program Assessment
- has registered staff in the Colorado Shines Professional Development Information System (PDIS)
- has completed Colorado Shines Level 2 E-learning Courses
- Levels 3-5: Program is licensed and in good standing, plus:
- has completed the Level 2 requirements
- has been assessed and rated by a Colorado Shines Quality Ratings Assessor based on points in five categories (workforce qualifications, family partnerships, administration, learning environment, child health)
Chart 7. Colorado Shines Ratings for Classrooms with DPP Study Participants
Analyses were conducted to test whether the type of provider (DPS vs. Community) was associated with the level of Colorado Shines rating. The two types of programs differed with mean rating levels slightly higher for DPS programs (4.02 versus 3.51).15
Class Observations
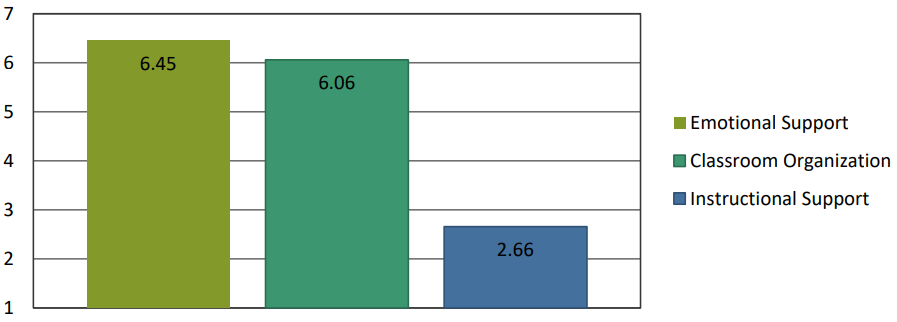
Chart 8 displays the mean scores for the 64 classrooms that were observed using the CLASS® observation. On average, scores for Emotional Support and Classroom Organization were high, while scores for Instructional Support were near the bottom of the middle-range. Average scores for Emotional Support and Classroom Organization were slightly higher than average scores from previous large studies. As described above, in previous large studies using this observation tool, average scores for Emotional Support tended to be in the 4.5-5.5 range and average scores for Classroom Organization tended to be in the 4.5-5.0 point range. Scores for Instructional Support were similar to what has been observed in previous large studies, which have been in the 2-3 range.
Chart 8. Average CLASS® Domain Scores (n=64 Classrooms)
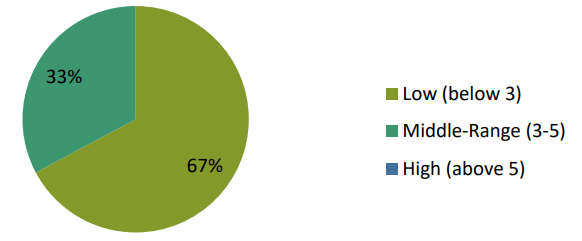
Charts 9, 10, and 11 provide information about the variability in these domain scores. For Emotional Support, all classrooms scored in the high range (scores above five). For Classroom Organization, nearly all classrooms scored in the high range, no classrooms scored in the low range (below three), and one classroom scored in the middle-range. For Instructional Support, over two-thirds of classrooms scored in the low range, slightly less than 33% scored in the middle range, and no classrooms scored in the high range.
Chart 9. Distribution of Scores for Emotional Support (n=64 Classrooms)
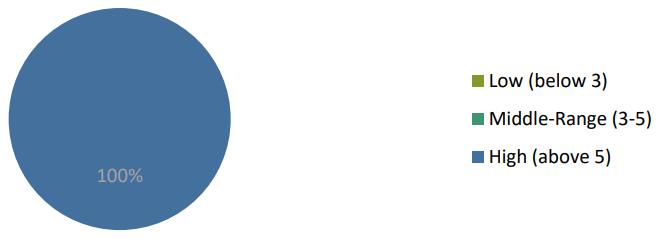
Chart 10. Distribution of Scores for Classroom Organization (n=64 Classrooms)
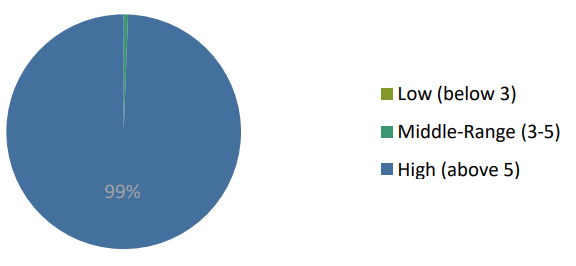
Chart 11. Distribution of Scores for Instructional Support (n=64 Classrooms)
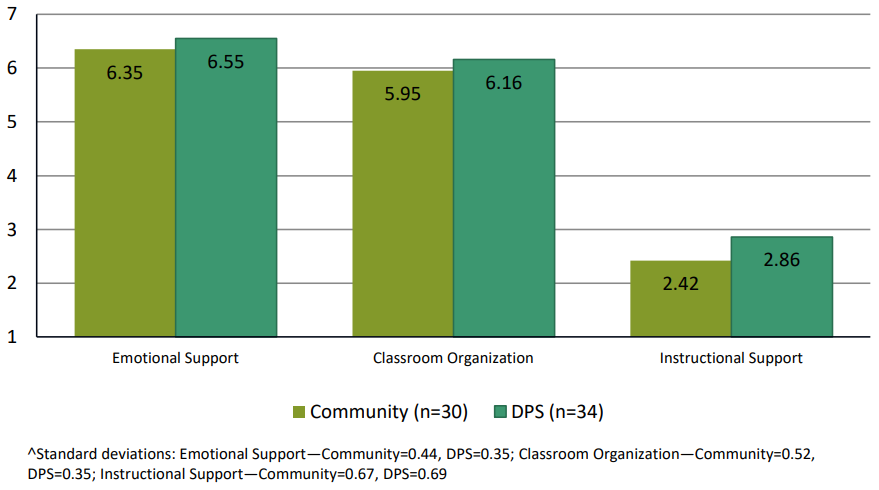
We also conducted analyses to test for differences in CLASS® domain scores by provider type. The results of these analyses are presented in Chart 12. Scores for all CLASS® subscales were not statistically different, on average, for DPS classrooms compared with community-based preschool classrooms.16
Chart 12. CLASS® Domain Scores by Provider Type
Does Quality Impact Child Outcomes?
For this analysis, we examined the association between CLASS® observation data as a proxy for preschool quality and child outcomes. However, there was very little variability in the Emotional Support domain (see Chart 9), and Classroom Organization (Chart 10), so we only focused on Instructional Support. To examine the association between quality and child outcomes, we computed correlations between spring assessment scores and CLASS® domain scores. No significant associations were observed for any of the spring assessments and the CLASS® Instructional Support Domain with the exception of a significant negative correlation with teacher-rated Total Protective Factors (r = -.23, p < .05) and a significant positive association with parent-rated Total Protective Factors on the DECA (r = .29, p < .05.) This means that parents who rated children as having higher protective factors were those whose children attended classrooms with higher CLASS® scores.
In addition, because this is the first year for which Colorado Shines data were available, we additionally examined rating levels impact on spring assessment scores in the same fashion. No significant associations were seen between this estimation of quality and child assessment results, with the exception of a very small significant association between Shines and English receptive vocabulary scores (r = -.13, p < .05).
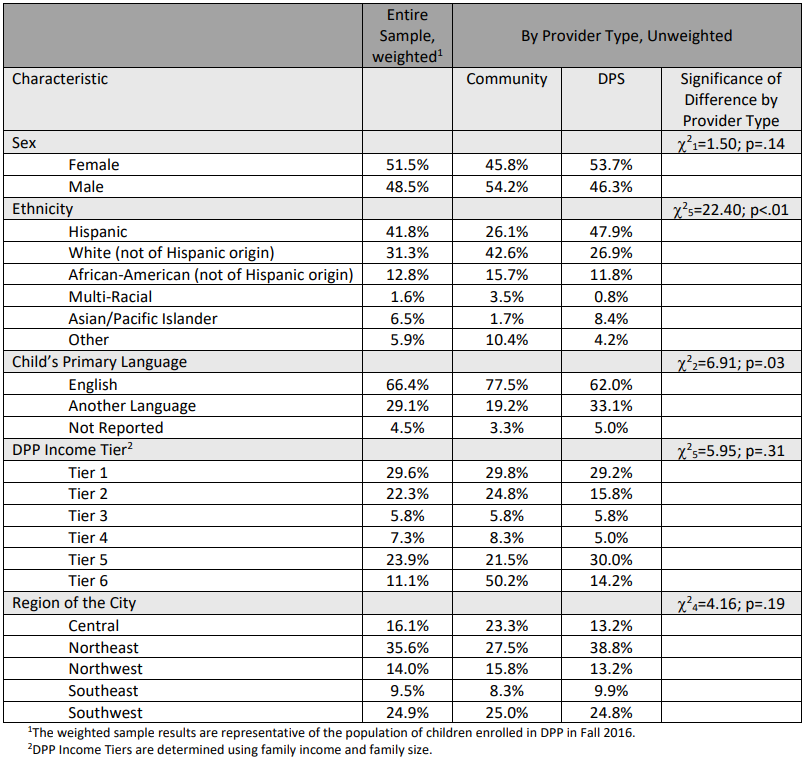
Appendix A. Sample Characteristics – Spring 2017
Supporting Documentation
- ANOVA (Analysis of Variance) is a statistical technique that compares mean scores for specified groups. Repeated Measures ANOVAs take into account scores at multiple points in time. This analysis compares the amount of change over time for specified groups.
- F(3)=3.66, p.=.02.
- It does not make sense to conduct this set of analyses for assessments administered in Spanish, since there is not adequate variability in children’s primary language among children assessed in Spanish.
- For analyses of assessments administered in Spanish, a two-level income tier group variable was used omitting the categories ‘tiers 3-5’ and ‘tier 6’ because only three child assessed in Spanish fell into tiers 3-5 and one children assessed in Spanish fell into tier 6.
- x25 = 25.43, p.<.0001
- x21 = 87.14, P<.0001
- x21 = 19.49, P<.0001
- x21 = 42.93, P<.0001
- x21 = 78.52, P<.0001
- x21 = 27.72, P<.0001
- x21 = 32.40, P<.0001
- LEBUFFE, P. A., & NAGLIERI, J. A. (1999). TECHNICAL MANUAL FOR THE DEVEREUX EARLY CHILDHOOD ASSESSMENT (DECA). VILLANOVA, PA: DEVEREUX FOUNDATION.
- Working Memory x2(1) = 6.11, P=.01; x2(1) = 13.64, P<.0001;
- From the Colorado Departments of Human Services and Education http://coloradoshines.force.com/ColoradoShines/programs?p=Your-ProgramColorado-Shines
- t=4.15, df=113, p<.001
- Emotional Support—t=1.99, df=62, p=n.s..; Classroom Organization—t=1.95, df=62, p=n.s.; Instructional Support—t=2.59, df=62, p=n.s